How to Measure Field Sales Productivity: 7 KPIs Every Sales Manager Should Track
7 KPIs That Help Measure Field Sales Productivity
As a manager or the owner of a brand, in order for you to take the right decisions, having the right data is your foundation and your starting point. However, knowing what metrics to track on priority, is what matters most.
Lines Per Call (LPC)
Lines Per Call measures how many SKUs a rep sells in a single outlet visit. It’s one of the clearest indicators of selling skill and product knowledge.
A representative who visits 20 outlets a day, but sells only one SKU per stop is who you would call an order-taker. A rep who upsells, cross-sells, and introduces new products at every call is a field salesperson and this distinction matters enormously at scale!
Why it matters for managers: Low LPC often signals gaps in product training, weak promotional execution, or poor route planning that leaves reps rushed. Identifying underperformers on this metric before the month closes gives you time to course-correct and this is something an effective sales KPI tracking software India can help.
Productive Calls Ratio
Not every outlet visit will result in a sale – the productive calls ratio tells you what percentage of your rep’s visits actually generate an order. Yes, industry benchmarks might vary, but a productive call ratio below 60–65% in most FMCG categories is considered a red flag. It could point to poor outlet selection, cold-call-heavy routing, or reps visiting outlets that are simply out of stock capacity.
Why it matters for managers: This ratio helps you evaluate route quality as much as rep performance. If a rep has a low productive call ratio despite high visit counts, the route, might be the problem, not the rep!
Average Order Value (AOV)
Average Order Value tracks the mean value of each order booked by your field team. It’s a revenue intensity metric that complements volume metrics like call counts and outlet coverage.
A rep visiting 25 outlets and booking ₹1,000 per order is generating very different business than a rep visiting 15 outlets and booking ₹4,500 per order. Neither profile is inherently better, because it ultimately depends on your category and channel strategy; but understanding the distribution of AOV across your team reveals where upselling opportunities are being left on the table.
Why it matters for managers: AOV, tracked over time at the rep level, is one of the best indicators of whether your incentive structures are working. If AOV stagnates even though there is volume growth, your reps are most likely pushing those easy SKUs and ignoring the margin-accretive products.
Strike Rate
Strike rate is the ratio of orders placed to calls made and is related to productive call ratio but with a slightly different lens: it focuses on conversion efficiency rather than visit outcomes.
High strike rates usually point to strong relationships with outlet owners, good availability of stock at the distributor level, and effective handling of objections. A dip in strike rate is often one of the earliest indicators that something has gone wrong. It could vary from stock-out, a competitor promotion, or growing dissatisfaction at the retailer level.
Why it matters for managers: Monitoring strike rate by rep, via a sales rep tracking software India, by route, and by product category helps you localise problems quickly instead of treating a regional dip as a national strategy failure.
New Outlet Addition Rate
Distribution width is a growth lever. The new outlet addition rate tracks how many new retail points your team is adding to the active outlet universe within a given period.
An experienced field team that’s not growing the outlet base is essentially in maintenance mode. In competitive FMCG markets, especially in Tier 2 and Tier 3 towns where organised retail penetration is still low, outlet addition is one of the fastest routes to topline growth.
Why it matters for managers: This KPI is especially useful for evaluating new reps and for tracking the effectiveness of distributor expansion strategies. Pair it with activation data to ensure new outlets don’t just get enrolled — they get ordering.
Beat Adherence
Beat adherence measures whether your reps are visiting the outlets on their assigned routes, in the planned sequence, on the planned days.
This might sound like a compliance metric, and it is, but it is also a distribution health metric. If reps are cherry-picking outlets, like skipping small kirana stores in favour of easier modern trade accounts, then your weighted distribution numbers will tell you a different story than what’s actually happening on the ground.
Why it matters for managers: Low beat adherence is almost always upstream of distribution gaps. Catching it early using an efficient beat plan optimization software India prevents those gaps from showing up as lost revenue in your quarterly review.
Sales Achievement vs. Target (SA%)
The most essential and fundamental KPI on this list, and the one most often tracked in isolation, which is exactly the problem. Sales achievement percentage measures how much of a rep’s assigned target they’ve met within a given period. On its own, it’s a lagging indicator, but when paired with the six metrics above, it becomes a diagnostic tool.
A rep at 75% achievement with strong beat adherence and high strike rate has a distribution problem. A rep at 75% with low productive call ratio and poor LPC has a skills problem. The number is the same, but the intervention is entirely different.
Why it matters for managers: SA% should always be read in context, because is you are only looking at the headline number, you’re a month behind on every problem your team has.
What is interesting is that most sales managers know these KPIs. The gap lies in the execution, specifically, the ability to access this data in real time, at the rep level, without waiting for a Monday morning report that’s already three days old. This is the gap that field force tracking software India can fill.
A well-implemented sales force automation platform doesn’t just digitise your order-taking process; it gives you a live dashboard of every metric listed above, broken down by rep, route, region, and product, updated as calls happen. Whether your team is 50 people or 500, Manacle Technologies can help you get organised.
Book a demo of our field force management software India to see how leading FMCG companies are tracking field sales productivity in real time and using that data to make faster, smarter decisions at every level of the sales hierarchy.
Written by
Purnima Menon
Related Articles

Top 10 Challenges in Field Sales Management (and How to Solve Them Digitally)
Field sales management's core difficulties—like inaccurate data and inefficient routes—are overcome by switching to AI-integrated digital solutions. This results in real-time visibility, automated reporting, and a consistent customer experience across a scaling team.
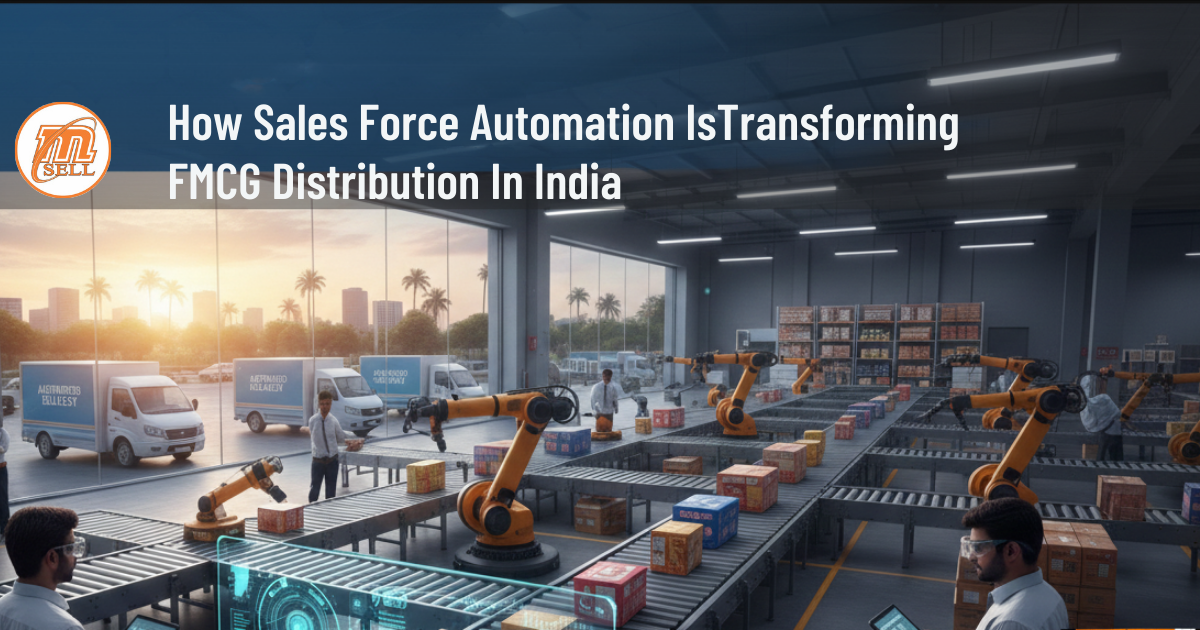
How Sales Force Automation Is Transforming FMCG Distribution In India
FMCG growth is rising, but old-school operations slow everything down. SFA brings real-time data, faster orders, stronger distributor control and sharper store execution. It turns guesswork into clear action. If you want smarter decisions and tighter performance, SFA is the shift you need.
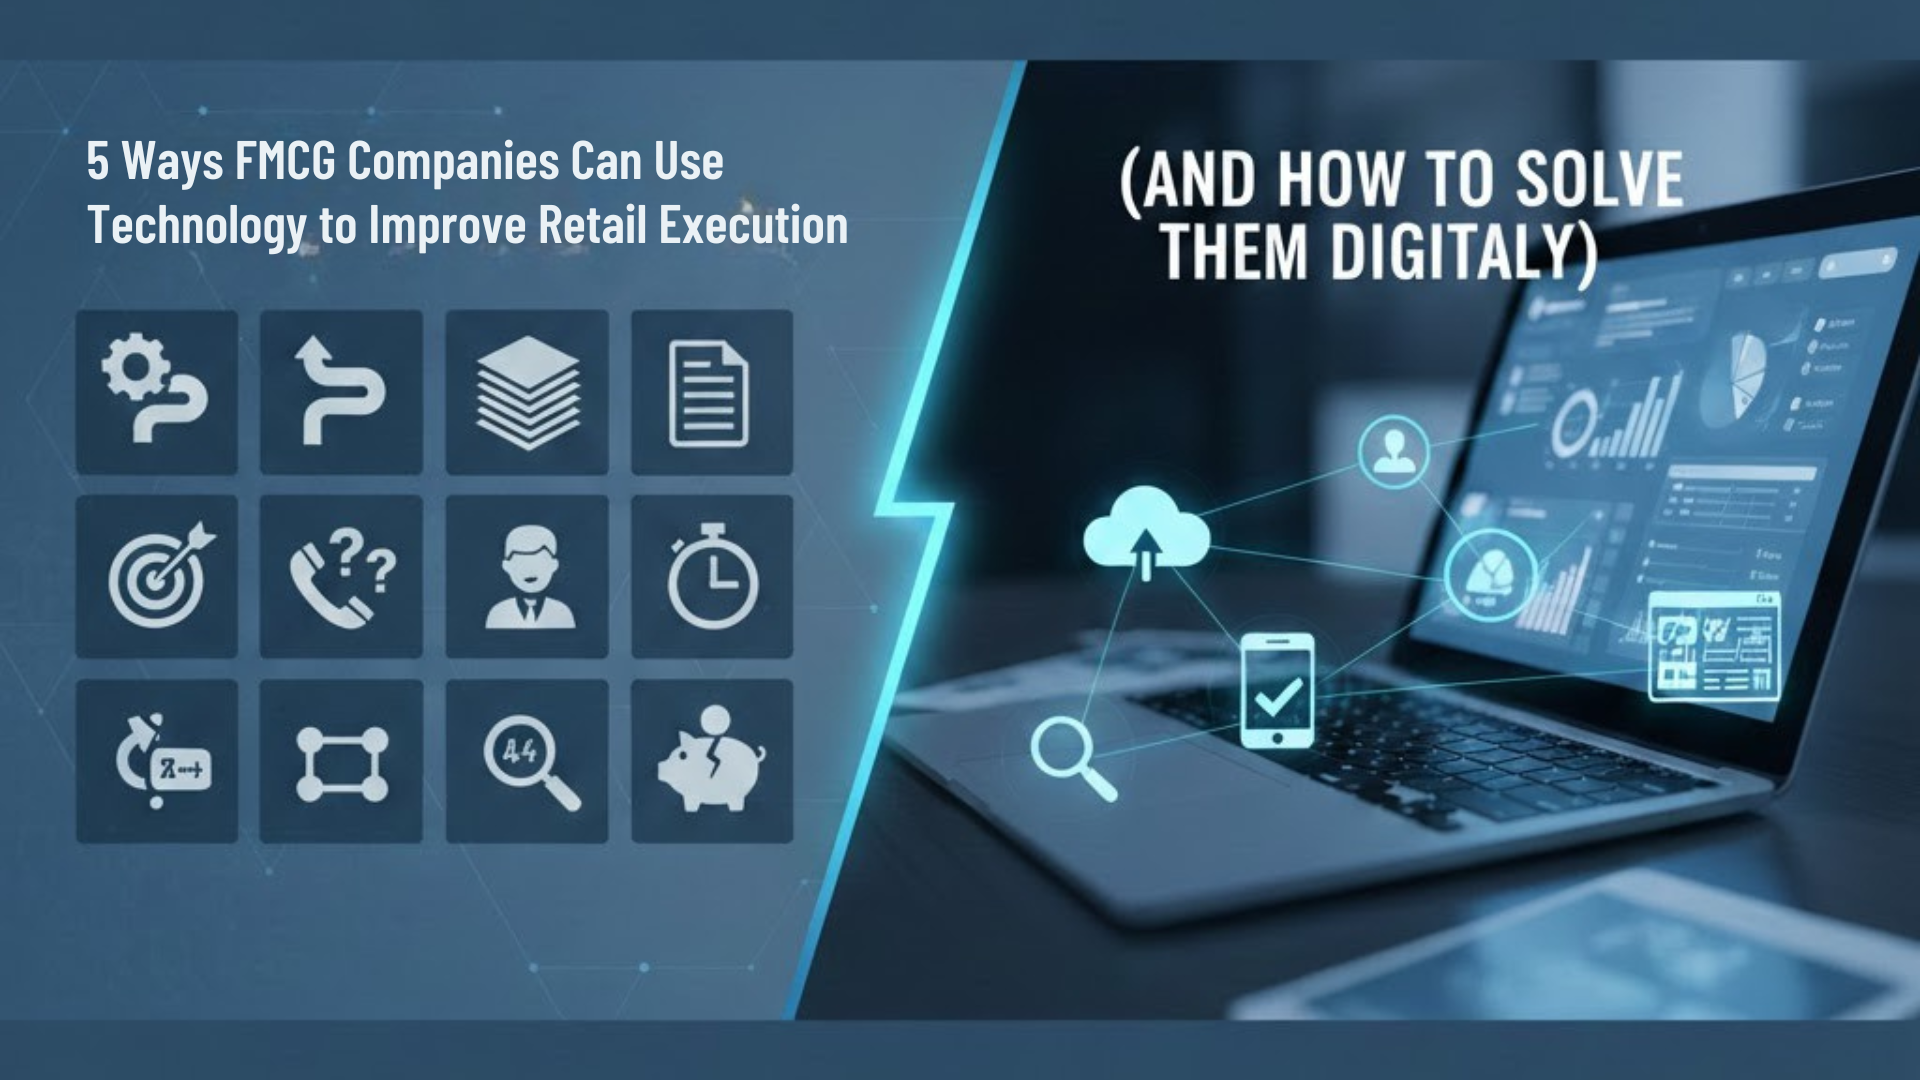
5 Ways FMCG Companies Can Use Technology to Improve Retail Execution
Fast-Moving Consumer Goods (FMCG) is a constantly growing domain with more brands and more products being added, almost every other day. Being a retail sector, execution is always one of those areas, where small gaps could lead to significant losses. A missed stock-out, an incorrect planogram, or a delayed order might look minor on a dashboard, but in the FMCG world, it translates into lost visibility on the shelf and lost revenue, which competitors might take advantage of! But there is good news! The arrival of Artificial Intelligence (AI) in retail and automation in the FMCG sector is changing how companies operate not only internally, but also at store level.